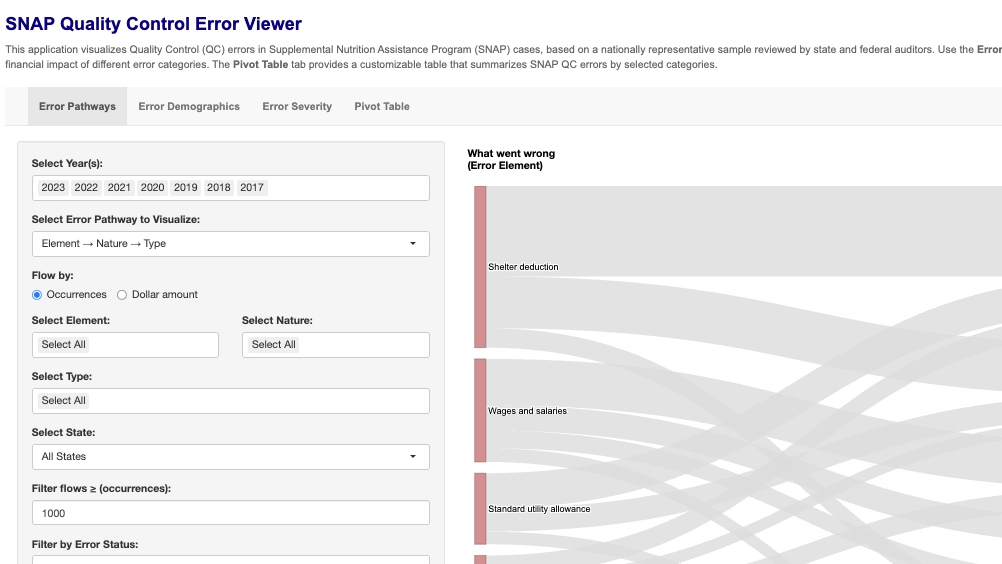
This online tool allows analysts, policymakers, and state agency staff to visualize QC-data such as error-rates, overpayments, underpayments, and state-level performance over time in an accessible graphical format.
It supports deeper understanding of how the SNAP QC process functions—namely random case-selection, interview verification, state + federal review, and corrective action—as described by the US Department of Agriculture Food and Nutrition Service.
Share this Example:


