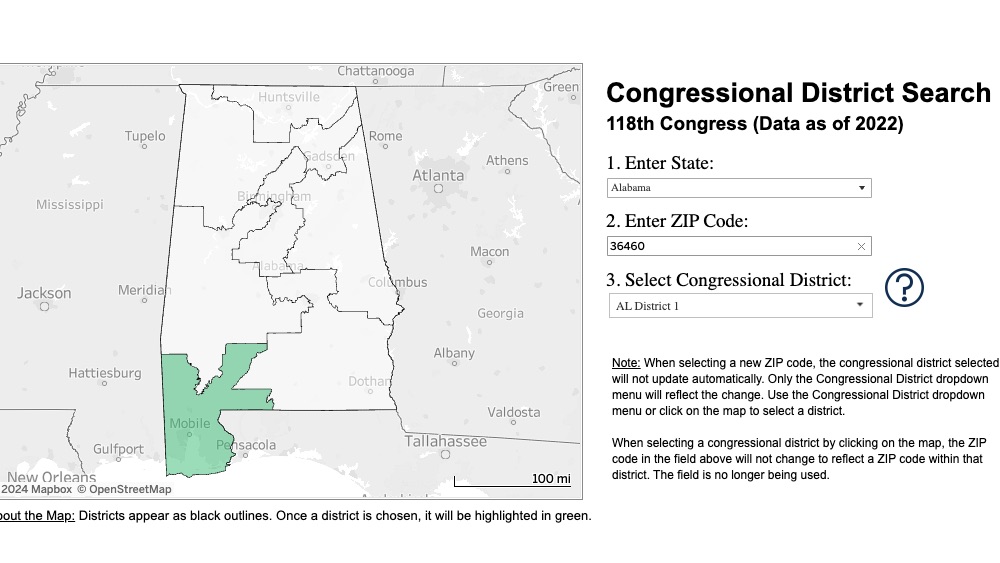
Developed by the USDA Food and Nutrition Service (FNS), this tool presents annual data on household SNAP participation, poverty rates, and demographics across congressional districts from 2014 to 2023.
Users can compare trends by district, including breakdowns by race, ethnicity, income, and presence of children, elderly, or people with disabilities. The dashboard supports data-informed outreach and policymaking by highlighting geographic and demographic disparities in SNAP access and participation.
Share this Resource:


