This policy blueprint outlines six actionable steps for state governments to improve digital identity infrastructure, focusing on security, equity, innovation, and privacy.
A modification of Bolder Advocacy’s ACT!Quick capacity self-assessment tool to incorporate additional equity-centered capacities, engage community authentically, and conduct research in culturally responsive ways.
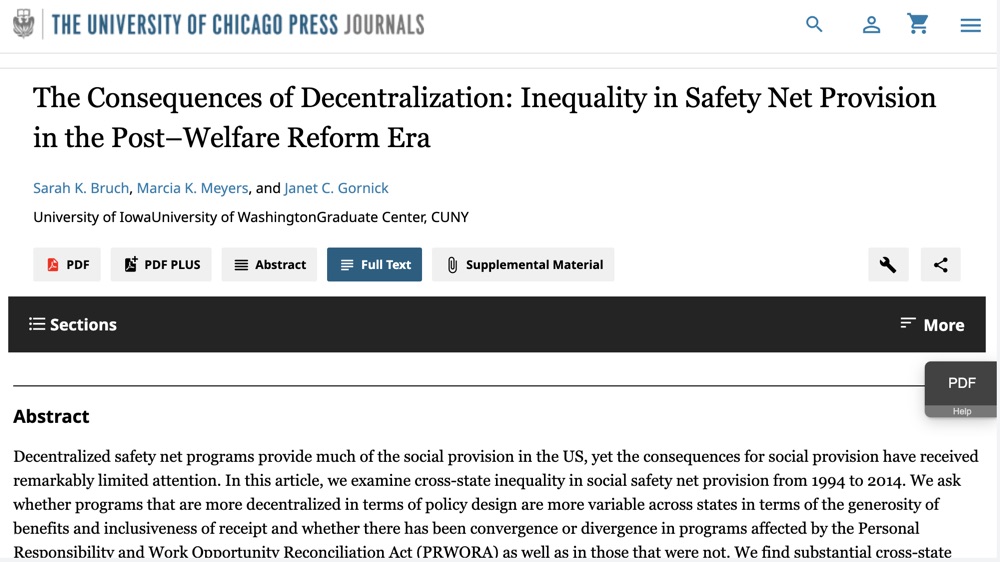
This article examines how the decentralization of safety net programs after welfare reform has led to growing inequality in benefit generosity and access across U.S. states.
This brief provides a summary of potential federal funding sources and programs that can be used to support programs specifically targeted towards young families. While this list is not exhaustive, it highlights major sources that can serve as a starting point for braiding and blending of funding to create comprehensive programming to serve young families.
American Public Human Services Association (APHSA)
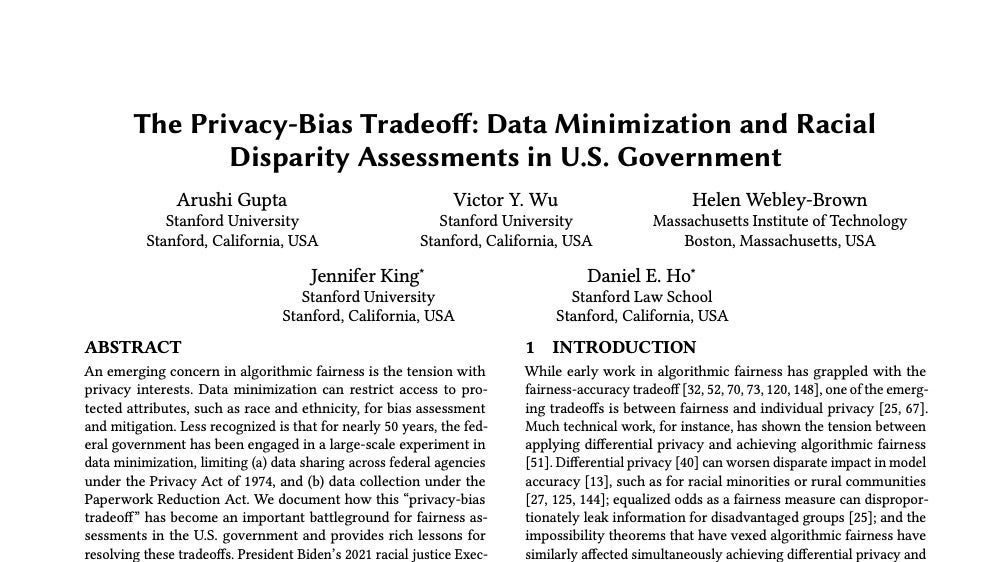
This academic paper examines how federal privacy laws restrict data collection needed for assessing racial disparities, creating a tradeoff between protecting individual privacy and enabling algorithmic fairness in government programs.
ACM Conference on Fairness, Accountability, and Transparency (ACM FAccT)
A case study of the Hawai‘i Career Acceleration Navigator — an accessible, data-driven and full-service government platform for unemployed people and other jobseekers to search for jobs and access supportive service benefits.
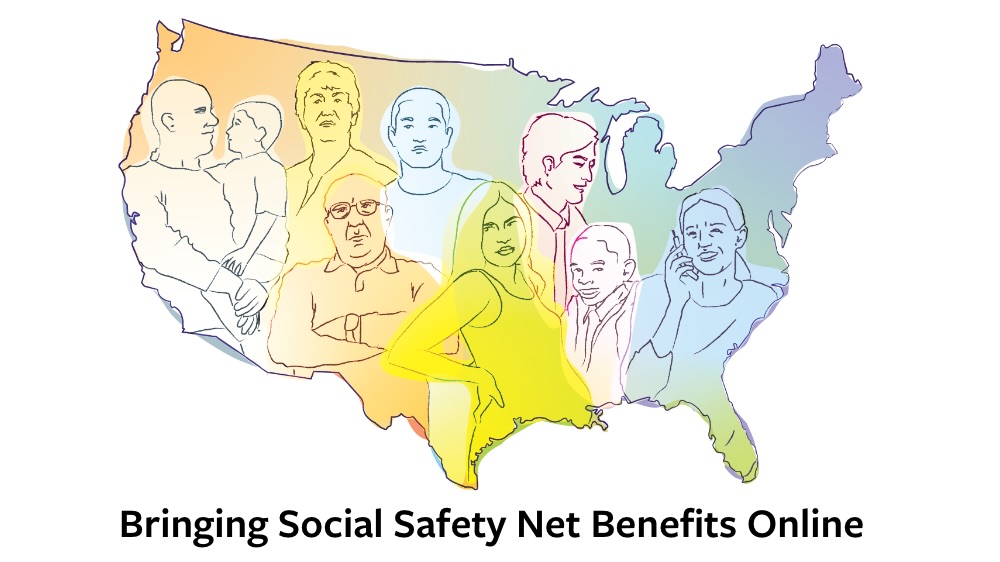
This visualized report is a first first-of-its-kind view of the state of benefits applications across the nation from a client perspective, including information on application availability online, combined benefit applications, application completion times, as well as login and identity proofing requirements.
The primer–originally prepared for the Progressive Congressional Caucus’ Tech Algorithm Briefing–explores the trade-offs and debates about algorithms and accountability across several key ethical dimensions, including fairness and bias; opacity and transparency; and lack of standards for auditing.
Drawing on interviews and convenings with experts and practitioners from the field of public interest technology, this report contains recommendations across five core priority action areas for cross-sector innovation and collaboration to improve state benefits systems through procurement practices.
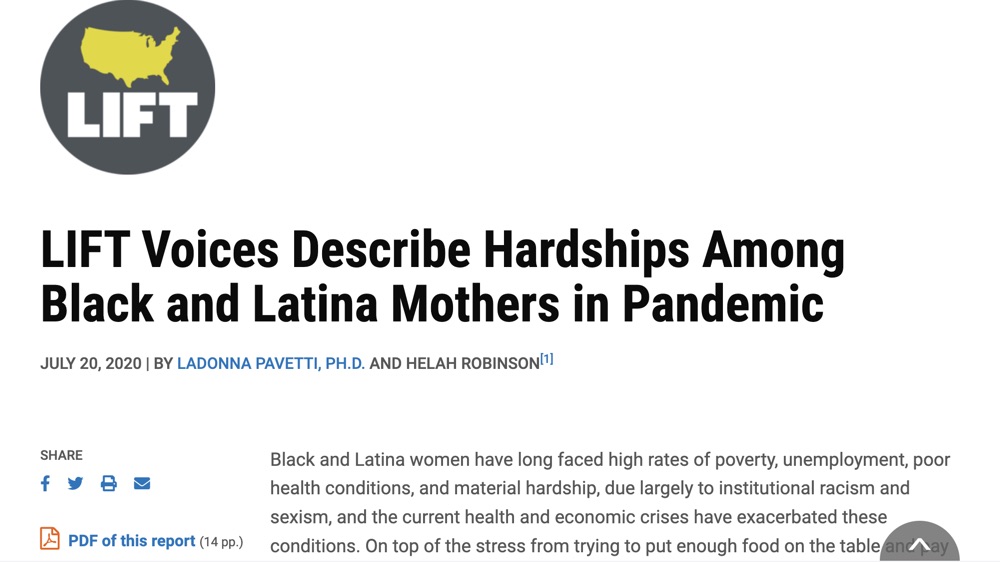
The Center on Budget and Policy Priorities (CBPP) report highlights the disproportionate hardships faced by Black and Latina mothers during the COVID-19 pandemic, exacerbated by systemic inequities.
This case study highlights Michigan’s integrated, data-driven approach to reducing food insecurity through cross-agency collaboration, referral tracking, and targeted outreach.
American Public Human Services Association (APHSA)