This resource provides guidance on streamlining enrollment across public benefit programs to improve efficiency, reduce administrative burdens, and enhance access for eligible individuals and families.
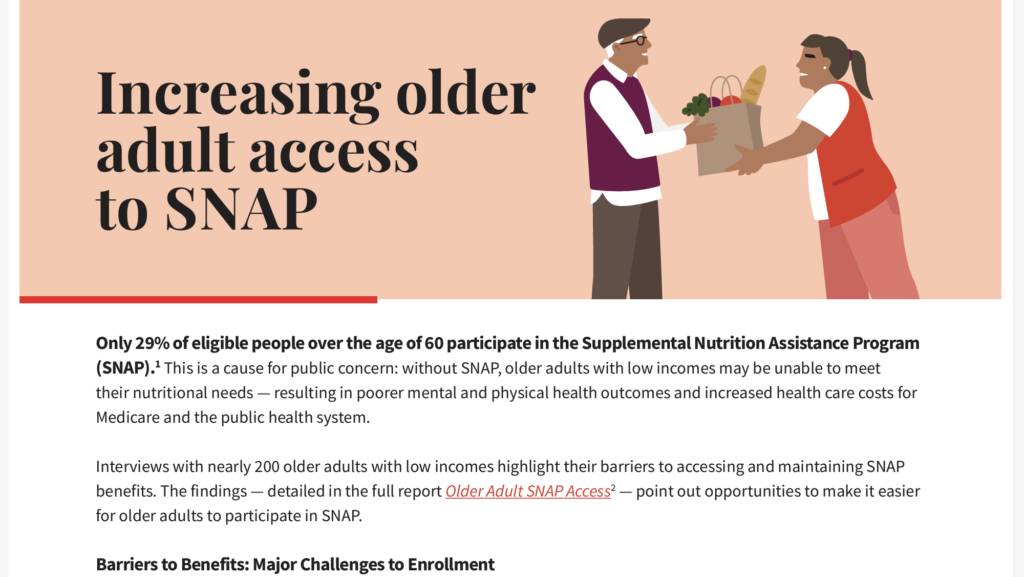
This brief highlights the complex journey that older adults experience when applying for and enrolling in SNAP, including the major barriers and solutions that improve access along the way.
This report by EPIC investigates how automated decision-making (ADM) systems are used across Washington, D.C.’s public services and the resulting impacts on equity, privacy, and access to benefits.
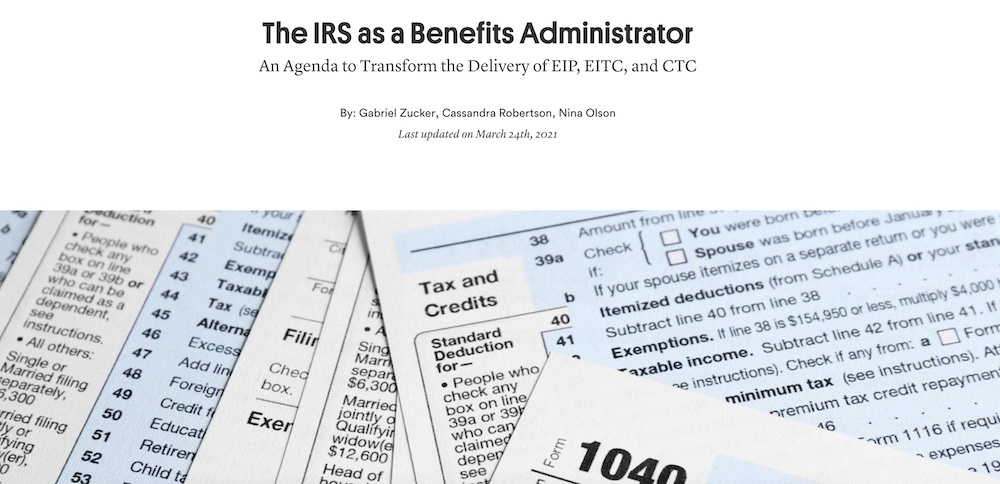
The IRS is arguably the single most critical benefits administrator in the country, given its responsibility for tax credit-based relief programs, and COVID-19 relief payments. Despite these programs’ incredible progress in reducing poverty, and despite great strides by the IRS to implement them successfully, accessing IRS benefits remains too difficult for many low-income families. This report presents a comprehensive agenda to increase benefit coverage rates, simplify Americans’ interactions with the IRS, and decrease the portion of IRS benefits diverted to third parties.
This guide explores intersectionality and why it is essential for advancing equity. It explores strategies for planning and conducting research with an intersectional lens, describes quantitative measures and methods to examine differences across groups of people with intersecting identities, and provides key considerations for using qualitative data to better understand intersectionality.
Office of the Assistant Secretary for Planning and Evaluation (ASPE)
This charter defines the goals, scope and organization of the “Integrated Service Delivery (ISD) Product Office” charged with planning, implementing, governing, and managing all business transformation, change, and systems modernization efforts related to integrated service delivery, focused initially on integrated eligibility and enrollment.
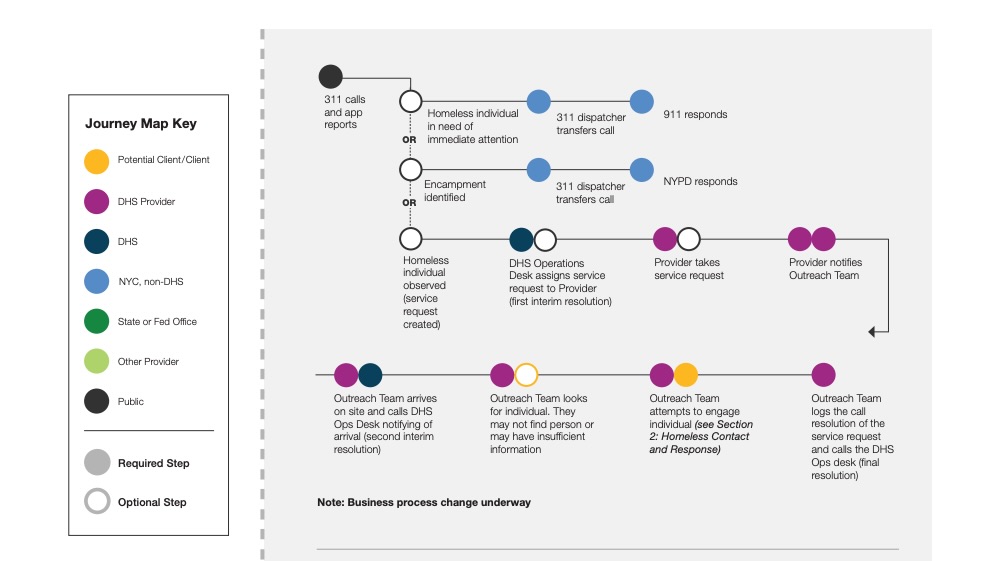
This overview journey map of street homeless outreach reflects the business process, and worker and client experience during the period January–April 2016 from initial observation, contact, case management, and placement in permanent housing. The map is displayed in eleven high-level sections, each with individual sub-level sections. Summaries and details for all the sections are presented in the subsequent pages. Each dot represents an individual or agency. Each cluster of dots represents a service interaction.