A case study of the Hawai‘i Career Acceleration Navigator — an accessible, data-driven and full-service government platform for unemployed people and other jobseekers to search for jobs and access supportive service benefits.
This report explores how state and local agencies can enhance customer service in health and human services by implementing technologies such as web-based tools, mobile applications, and call center innovations, aiming to streamline processes and improve client interactions.
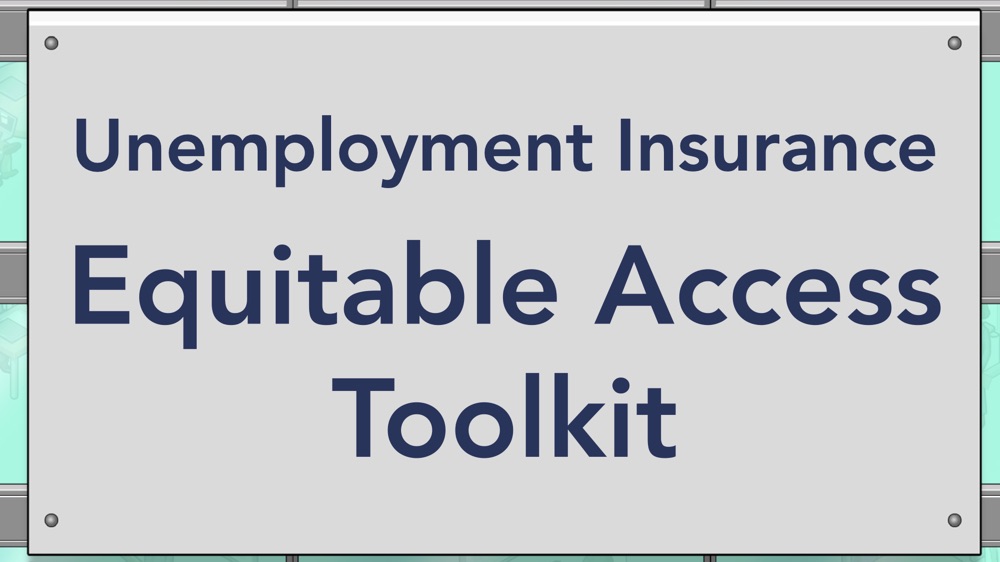
The Unemployment Insurance Equitable Access Toolkit contains common equity recommendations, promising practices, and insights, represented visually as a different floor of an agency office building, compiled in one interactive document.
In response to the COVID-19 crisis, the federal government authorized a new emergency program, Pandemic EBT (P-EBT), to replace school meals with money for groceries while schools are closed. Code for America describes its efforts to launch an accessible, online P-EBT application under an accelerated timeline due to to immense demand caused by the pandemic.
Innovators inside and outside of government are working to improve access to the social safety net using data, technology, and design. This report highlights innovations carried out by The Rockefeller Foundation’s Data and Technology grantees from 2018 to 2021, including extraordinary efforts to meet the challenges of the pandemic. Those grantees are: Benefits Data Trust, Code for America, Georgetown University’s Beeck Center for Social Impact and Innovation, U.S. Digital Response, and the Digital Innovation and Governance Initiative at New America. In 2020, these projects secured more than $200 million in benefits for close to 100,000 people across at least 36 states, and helped millions more through policy change, training, and guidance.
Fact sheet associated with policy guidance from the Office of Management and Budget (OMB) providing guidance on "The Delivering a Digital-First Public Experience."
To improve the .gov registrar, 18F and CISA created customer panels to gather feedback, opinions, and suggestions. Using a customer-centric approached enabled 18F and CISA to identify areas for improvement, build a product roadmap, and establish relationships with users.
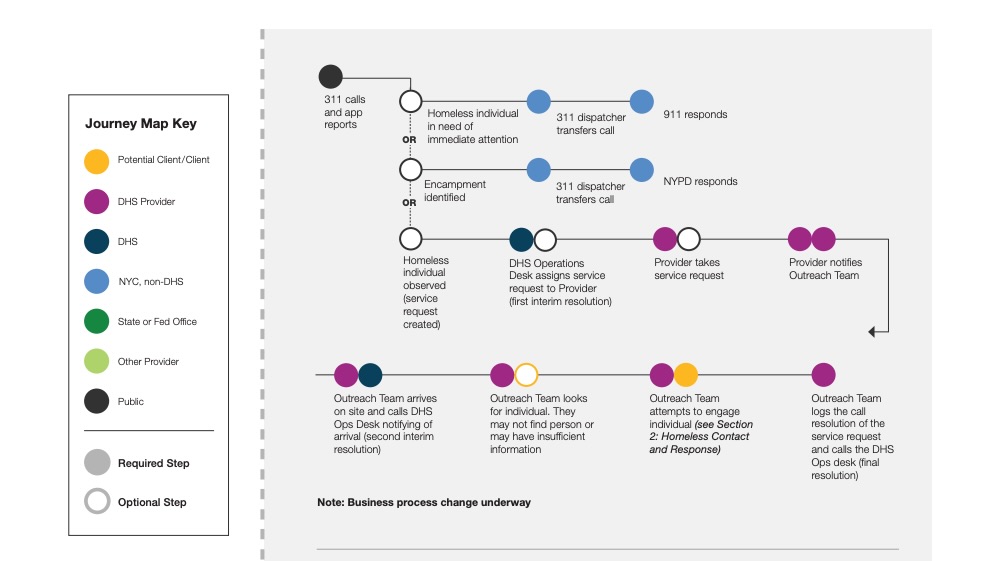
This overview journey map of street homeless outreach reflects the business process, and worker and client experience during the period January–April 2016 from initial observation, contact, case management, and placement in permanent housing. The map is displayed in eleven high-level sections, each with individual sub-level sections. Summaries and details for all the sections are presented in the subsequent pages. Each dot represents an individual or agency. Each cluster of dots represents a service interaction.