This memo provides guidance on conducting usability testing under the Paperwork Reduction Act (PRA), clarifying when PRA approval is required, and offering strategies for quickly implementing improvements based on usability feedback for federal forms and websites.
Through the Coordinating SNAP & Nutrition Supports program, Mecklenburg County, NC leveraged a Food Security Navigator model and data analysis to increase access to nutrition supports. This report documents best practices and lessons learned from their project.
American Public Human Services Association (APHSA)
Initially created for and shared with staff at the Administration for Children and Families, this webinar provides an introduction to Universal Design, covering plain language, accessibility, user research, and Agile development.
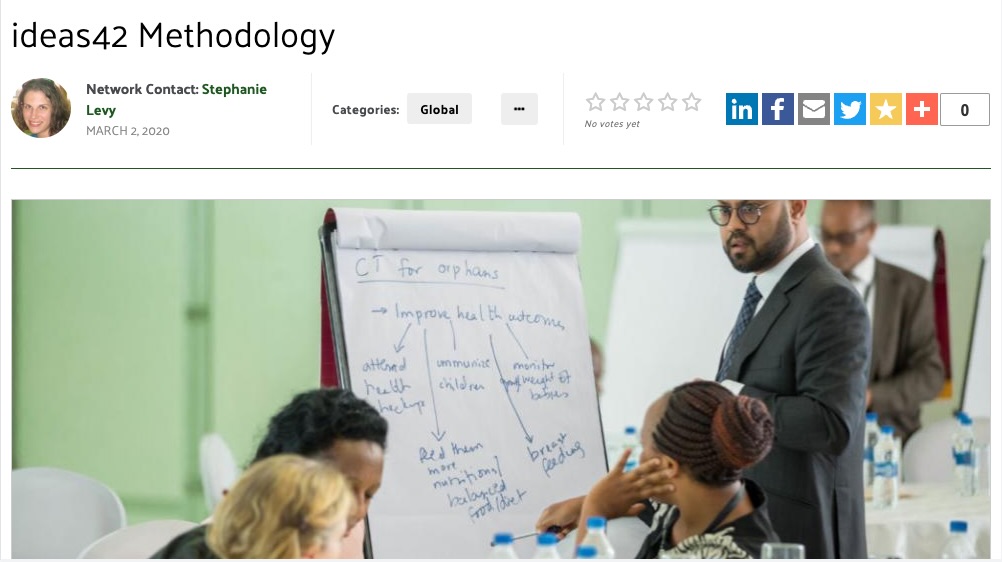
This article introduces ideas42, a non-profit behavioral research and design firm applying insights from behavioral sciences, including behavioral economics (BE), social psychology, and other disciplines, for social good. Their behavioral design methodology is human-centered, but it incorporates scientific insights and iterative testing, applying observations about how people choose and act from experimental academic research to inform qualitative research.
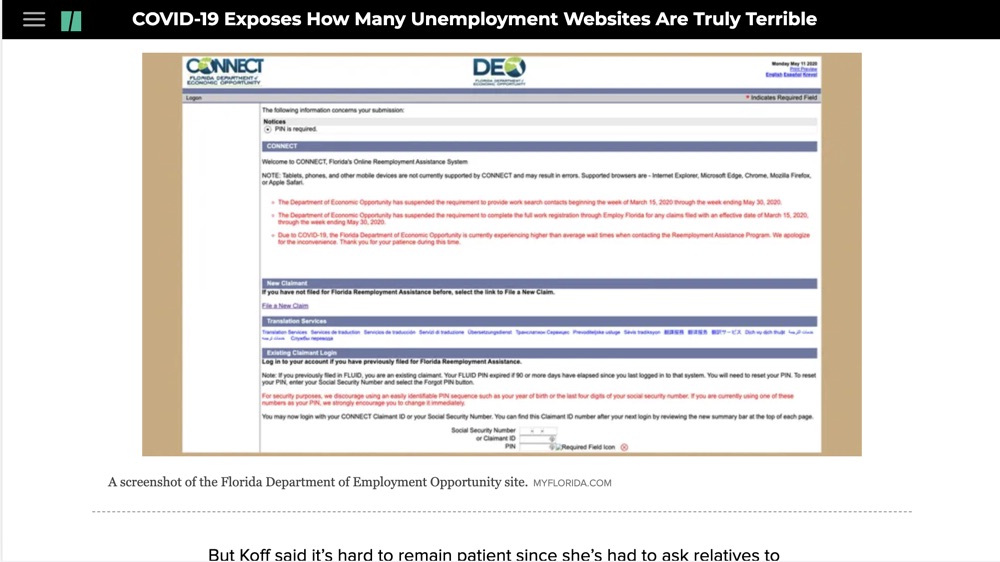
This HuffPost article investigates the widespread failures of state unemployment websites during the COVID-19 pandemic, highlighting outdated technology, accessibility issues, and the human impact of these systemic breakdowns.
Through our research understanding the government digital service field and what workers in this field need, we want to help strengthen those existing roles and establish more pathways for promotion and career support, as well as help other teams recognize the value of these skills and create new roles.
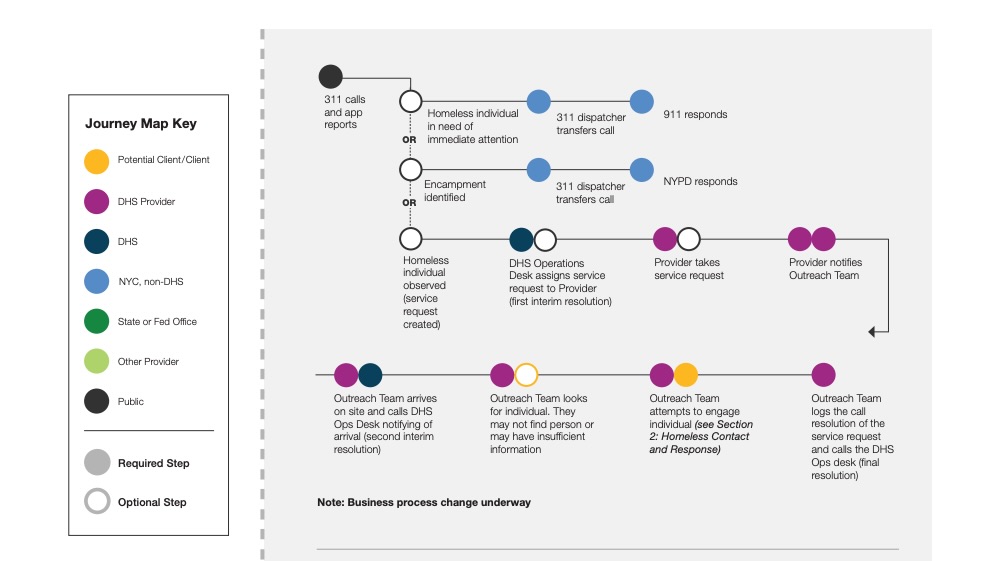
This overview journey map of street homeless outreach reflects the business process, and worker and client experience during the period January–April 2016 from initial observation, contact, case management, and placement in permanent housing. The map is displayed in eleven high-level sections, each with individual sub-level sections. Summaries and details for all the sections are presented in the subsequent pages. Each dot represents an individual or agency. Each cluster of dots represents a service interaction.
The UX Lead in the Data Strategy & Analytics division will be responsible for maintaining a user-centric focus throughout product development and creating a positive end user experience for a set of educational data and technology projects across multiple teams and will provide expertise and support to other agency initiatives.