This article examines how the City of Long Beach, California, collaborated with TOPC to develop a digital tool aimed at enhancing community engagement and expanding urban tree canopy coverage.
The user recruitment services resolution passed in Saint Paul, MN for a third year in a row in 2024. It allows for city funds to be used to compensate community members who participate in research.
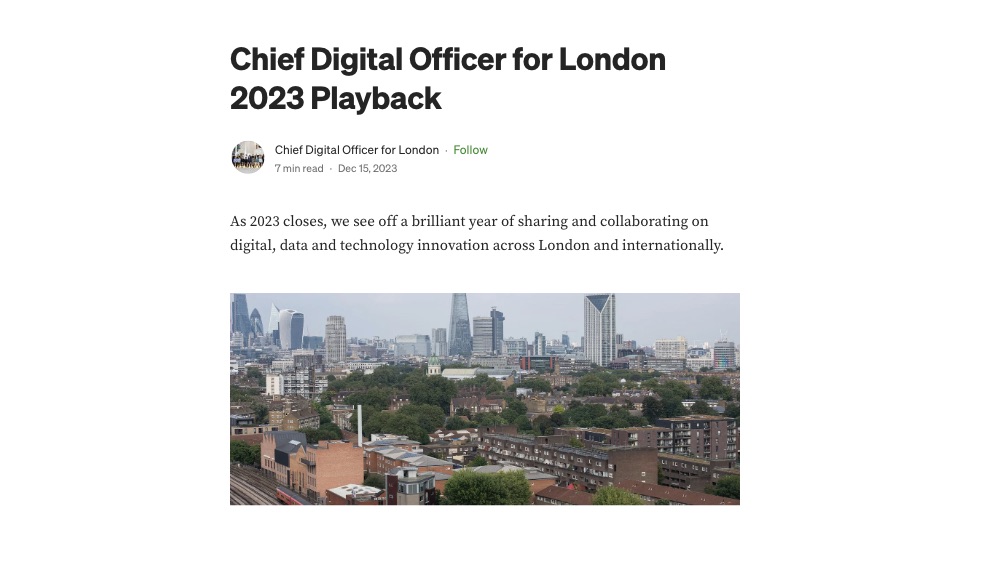
A 2023 playback from the city of London’s Office of Technology and Innovation of recent efforts to improve data and technology innovation across the city.
City of London Office of Technology and Innovation (LOTI)
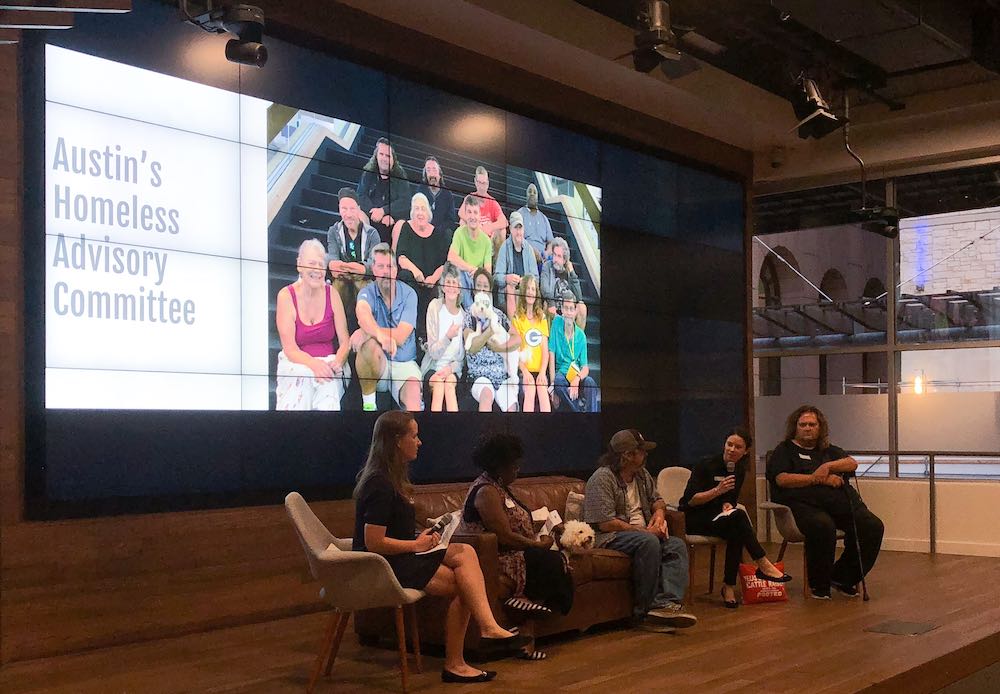
In Austin, there are over 2,000 individuals without a safe place to sleep. There are many reasons a person can become homeless, and these reasons range from the lack of affordable housing to the loss of family and community. In 2017, the Innovation Office secured a three-year $1.25m grant from Bloomberg Philanthropies to focus on the city's goal of ending homelessness. The grant funds an i-team to help the city identify the best ways for City Council, departments, and the community to collaborate towards a shared understanding of homelessness in Austin.
This guide outlines free and low-cost digital inclusion resources available in Long Beach, CA, including internet access, device distribution, digital skills training, and job readiness programs.
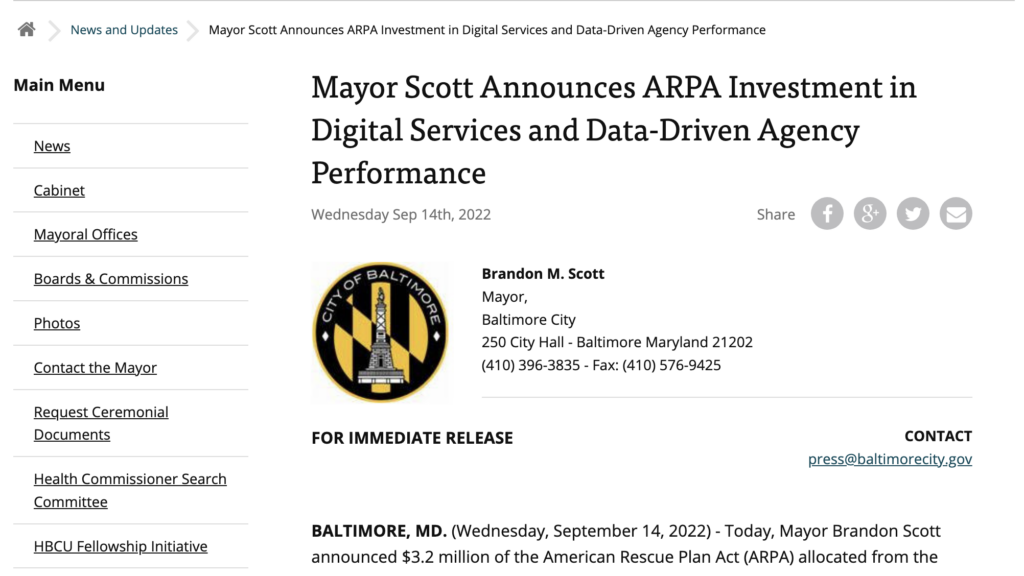
A Baltimore City press release announcing American Rescue Plan Act (ARPA) investments in digital services and data infrastructure to modernize city operations and improve resident access to government services.
The Ethical Artificial Intelligence (AI) Policy of the City of Tempe establishes principles and governance structures to ensure the responsible, fair, and transparent use of AI in municipal operations.