This case study explores how the City of Akron developed a community tree map to engage residents in urban forestry efforts, enabling them to identify, grow, and care for trees in their neighborhoods.
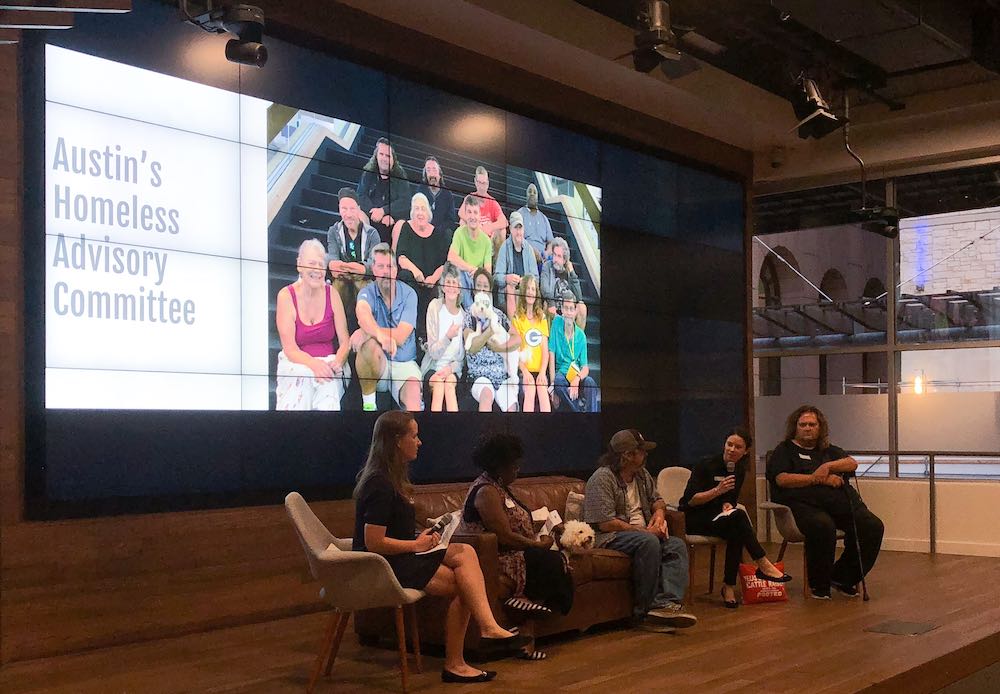
In Austin, there are over 2,000 individuals without a safe place to sleep. There are many reasons a person can become homeless, and these reasons range from the lack of affordable housing to the loss of family and community. In 2017, the Innovation Office secured a three-year $1.25m grant from Bloomberg Philanthropies to focus on the city's goal of ending homelessness. The grant funds an i-team to help the city identify the best ways for City Council, departments, and the community to collaborate towards a shared understanding of homelessness in Austin.
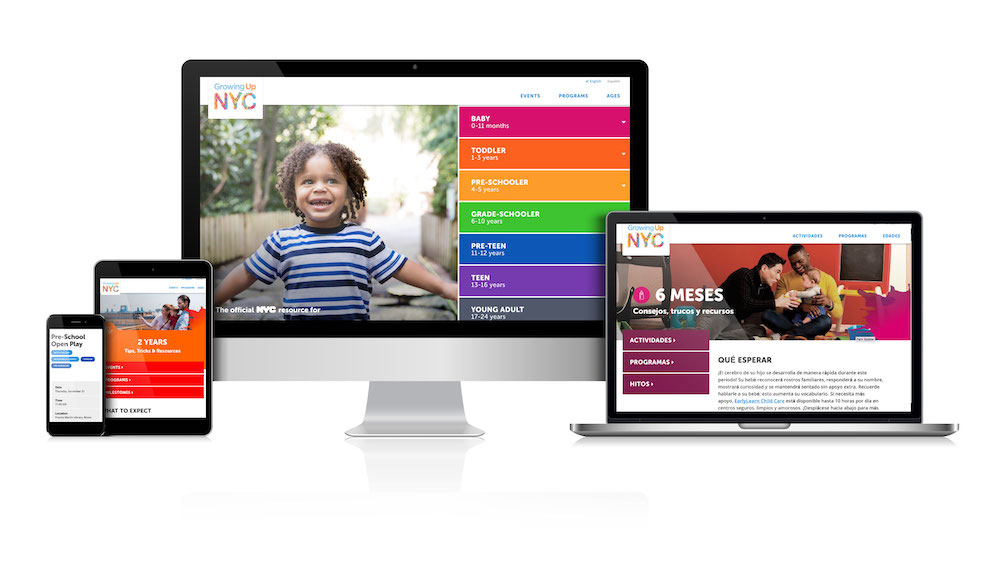
Growing Up NYC is mobile-friendly website that makes it simple for families to learn about and access city programs, as well as services and activities available to New York residents.
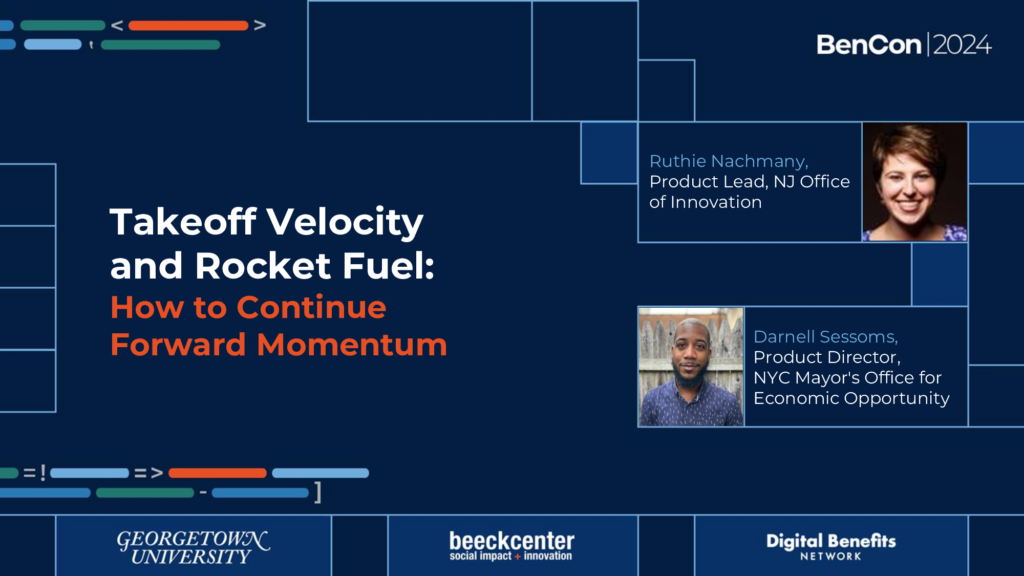
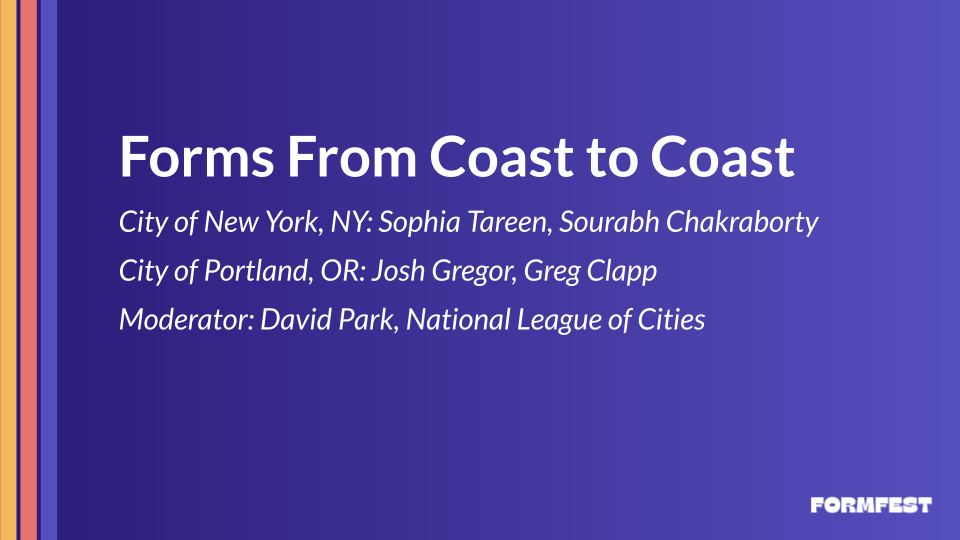
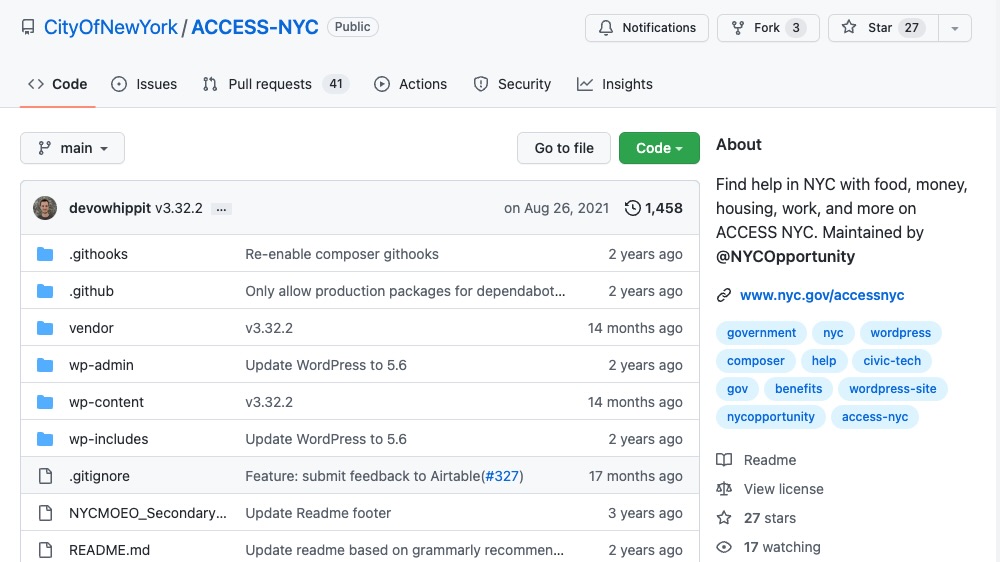
NYC's My File NYC and New Jersey's unemployment insurance system improvements demonstrate how successful digital innovations can be scaled across various programs, leveraging trust-building, open-source technology, and strategic partnerships.
This session from FormFest 2024 focused on human centered form improvements from the City of Reykjavik and the German Digital Service’s form simplification project.
This guide outlines free and low-cost digital inclusion resources available in Long Beach, CA, including internet access, device distribution, digital skills training, and job readiness programs.
This article examines how the City of Long Beach, California, collaborated with TOPC to develop a digital tool aimed at enhancing community engagement and expanding urban tree canopy coverage.
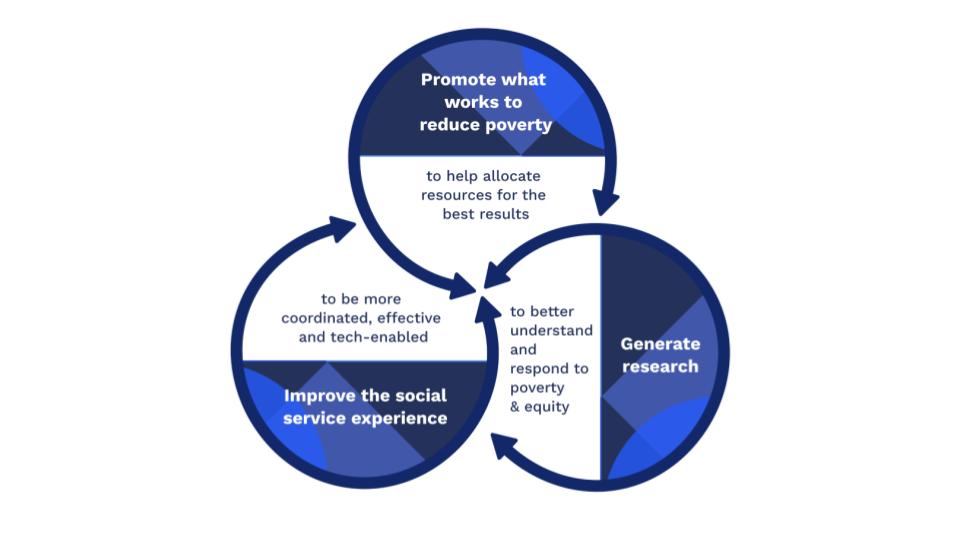
This retrospective looks at the way the NYCOpportunity initiative worked across City government, partnering with agencies to initiate new approaches and enhance city practices. It also highlights key areas of focus for the NYC Opportunity team between 2014 and 2021.