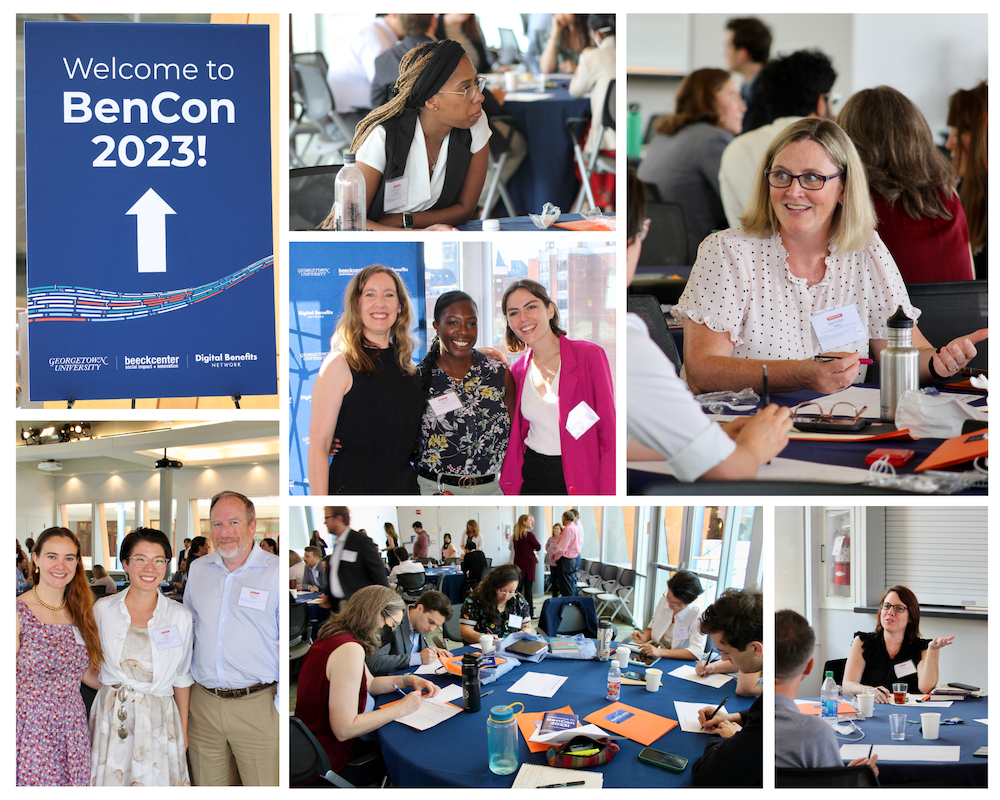
The article discusses key takeaways from BenCon 2023, highlighting the importance of creating equitable and ethical public benefits technology. It emphasizes the need for tech solutions that address systemic inequalities, ensure accessibility, and promote inclusivity for underserved communities in accessing public services.
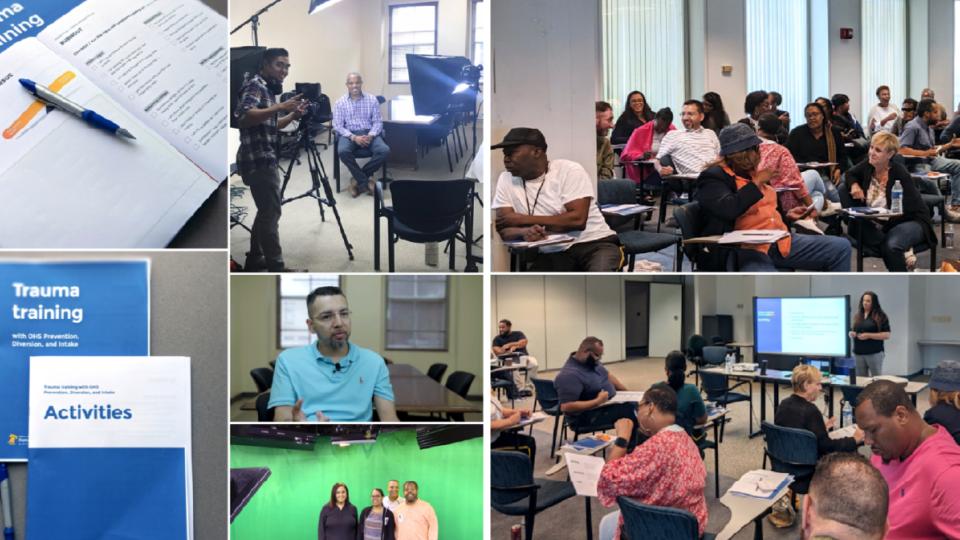
The report highlights a project to improve the Philadelphia Office of Homeless Services' (OHS) prevention and intake processes by implementing trauma-informed practices. In collaboration with staff, participants, and trauma experts, the project aimed to reduce distress for those accessing services while equipping staff with tools and training to better manage trauma-related interactions, creating a more supportive and empathetic service environment.
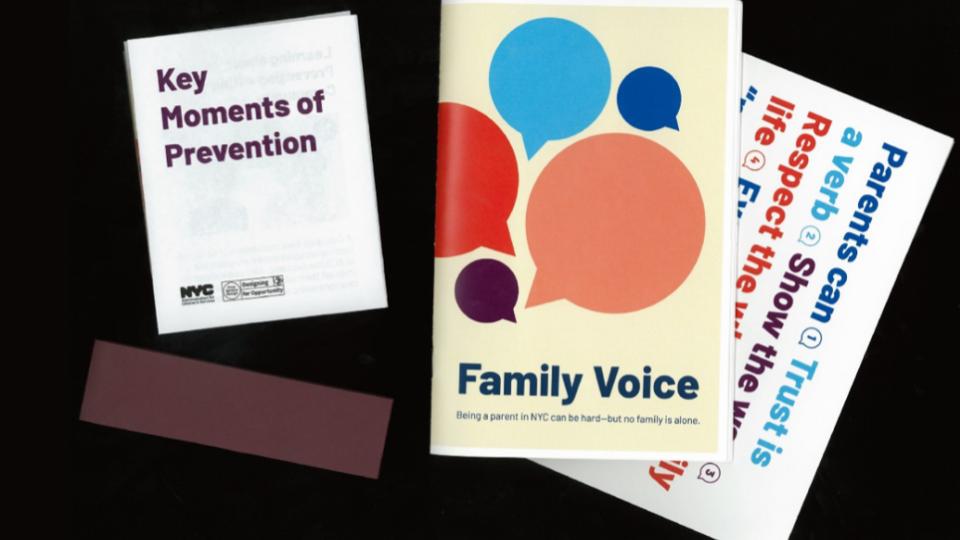
NYC Opportunity collaborated with the Administration for Child Services (ACS) to design a family-centered process for prevention services, addressing confusion and lack of choice in the current system. By creating tools like the Provider Profile and Family Voice booklet, the team empowered families to choose providers based on their needs while ensuring their feedback reaches ACS. The project aims to improve family experiences and communication with ACS, with plans to expand through testing and future innovations like a web portal.
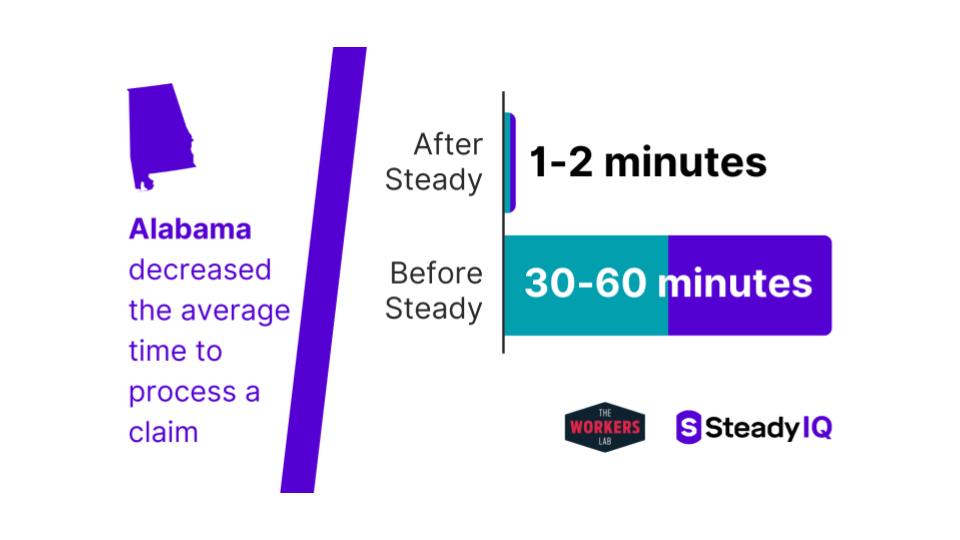
In response to COVID-19, the Workers Lab and Steady developed the "Income Passport" to streamline gig workers' unemployment benefit applications by pulling income data directly from gig platforms and financial accounts. This tool reduced manual verification time, helped prevent fraud, and improved workers' access to full benefits, with successful tests in Alabama and Louisiana demonstrating significant time savings and improved service delivery.
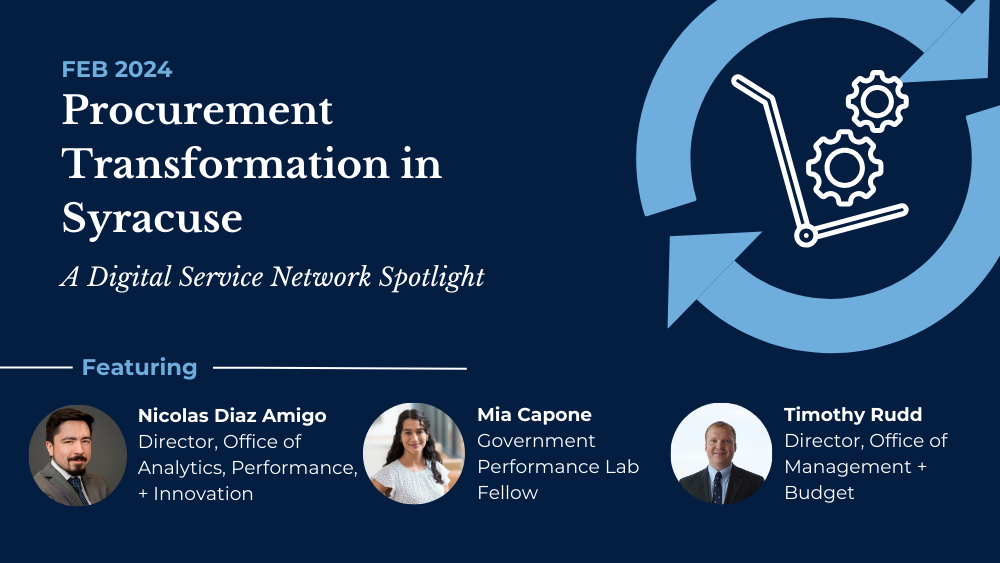
The Digital Service Network (DSN) spoke with API Director Nicolas Diaz Amigo, GPL Fellow Mia Capone, and OMB Director Timothy Rudd to learn more about the City of Syracuse's multi-year procurement transformation initiative.
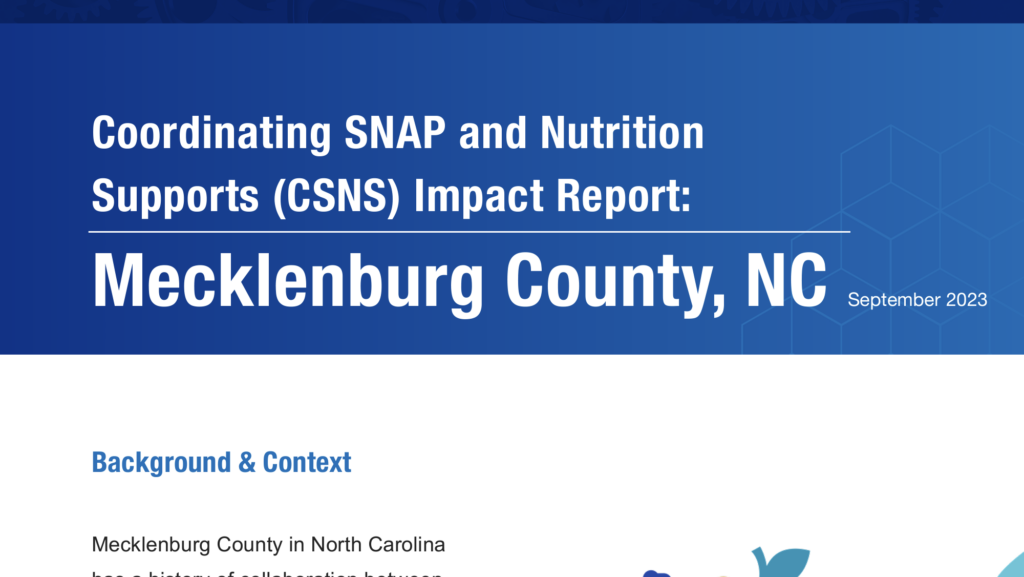
Through the Coordinating SNAP & Nutrition Supports program, Mecklenburg County, NC leveraged a Food Security Navigator model and data analysis to increase access to nutrition supports. This report documents best practices and lessons learned from their project.
American Public Human Services Association (APHSA)
Initially created for and shared with staff at the Administration for Children and Families, this webinar provides an introduction to Universal Design, covering plain language, accessibility, user research, and Agile development.
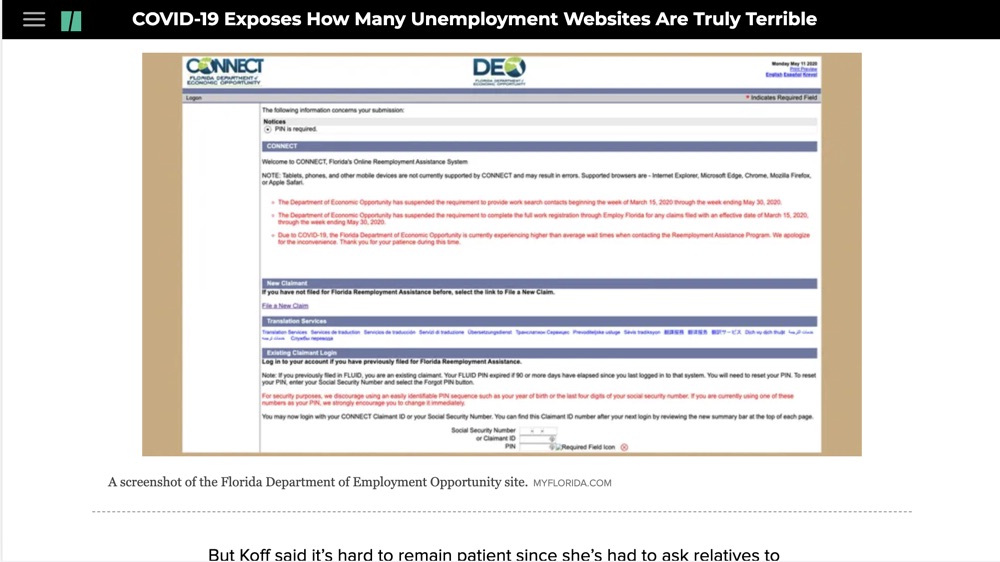
This HuffPost article investigates the widespread failures of state unemployment websites during the COVID-19 pandemic, highlighting outdated technology, accessibility issues, and the human impact of these systemic breakdowns.
Through our research understanding the government digital service field and what workers in this field need, we want to help strengthen those existing roles and establish more pathways for promotion and career support, as well as help other teams recognize the value of these skills and create new roles.