This article examines the matrix of vulnerabilities that low-income populations face from the widespread collection of big data and predictive analytics.
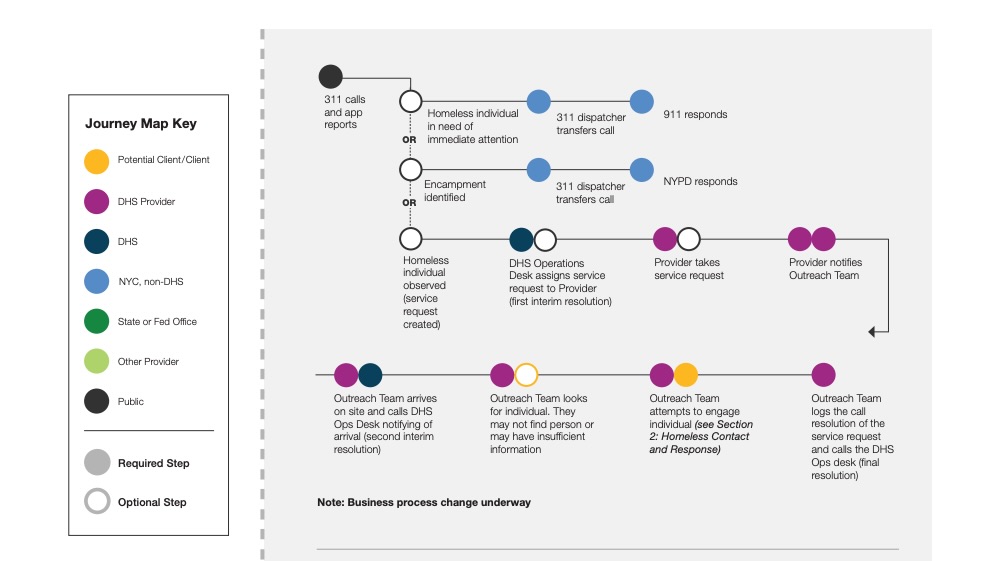
This overview journey map of street homeless outreach reflects the business process, and worker and client experience during the period January–April 2016 from initial observation, contact, case management, and placement in permanent housing. The map is displayed in eleven high-level sections, each with individual sub-level sections. Summaries and details for all the sections are presented in the subsequent pages. Each dot represents an individual or agency. Each cluster of dots represents a service interaction.
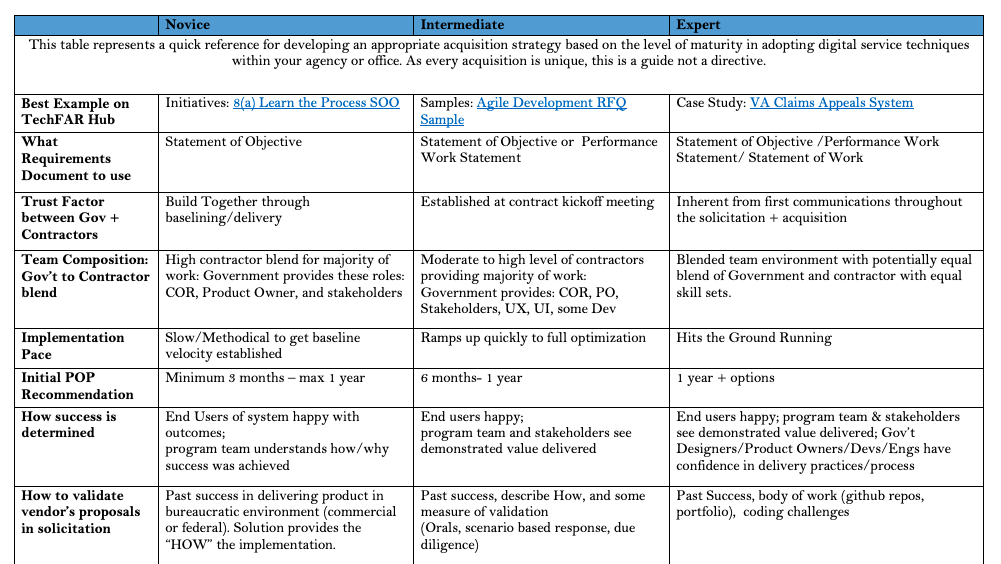
A practical guide that helps agencies choose appropriate acquisition strategies for digital projects based on their maturity with modern delivery practices.