This blog post describes how the NYC Service Design Studio engaged residents in the development of the Community Compensation Fund, highlighting lessons on trust-building, equitable collaboration, and inclusive community decision-making.
This primer introduces two foundational software types that can support organizations that are committed to accessible benefits information: content management systems (CMS) and application program interfaces (APIs).
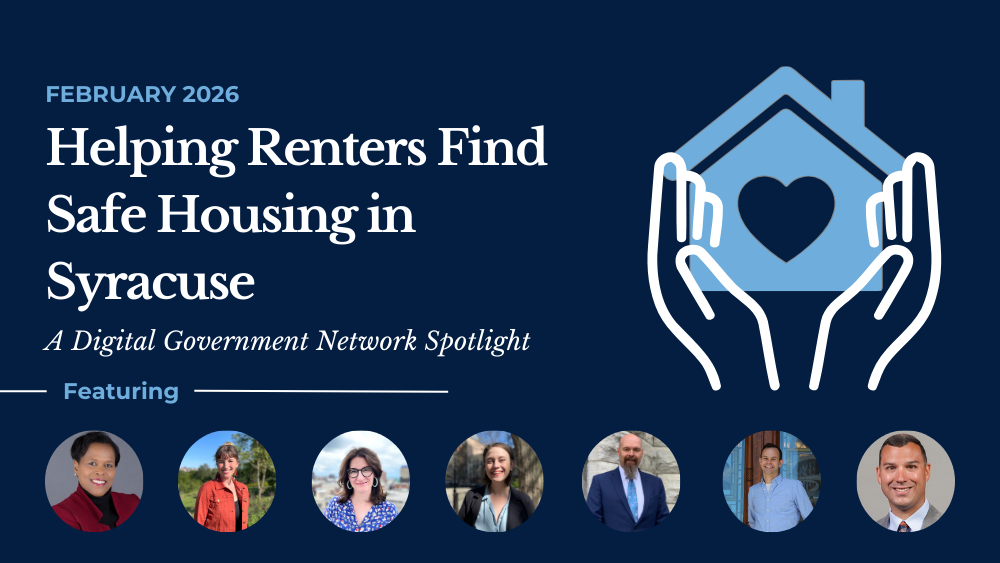
DGN Spotlights are short-form project profiles that feature exciting work happening across our network of digital government practitioners. Spotlights celebrate our members’ stories, lift up actionable takeaways for other practitioners, and put the resources + examples we host in the Digital Government Hub in context.
A FormFest profile highlighting how New York State’s design and technology teams are reimagining form creation through collaborative, human-centered design methods that simplify processes and expand participation.
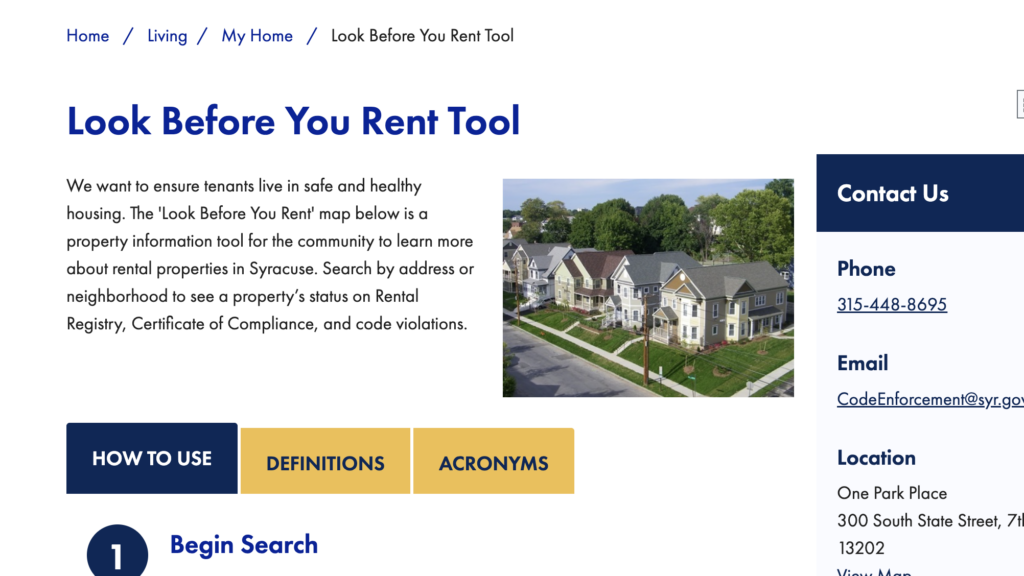
This blog describes the purpose and functionality of the Look Before You Rent online tool, which enables users to search rental property addresses and view any recorded housing code violations, inspection outcomes, or complaints.
NYC's My File NYC and New Jersey's unemployment insurance system improvements demonstrate how successful digital innovations can be scaled across various programs, leveraging trust-building, open-source technology, and strategic partnerships.