This data playbook created by the California Health and Human services agencies discusses five plays designed to help Departments utilize data to inform program and policy development.
California Health and Human Services Agency (Cal HHS)
CalAcademy is California’s public sector innovation training program, equipping state employees with modern skills like human-centered design, data analytics, and a product mindset to enhance government services.
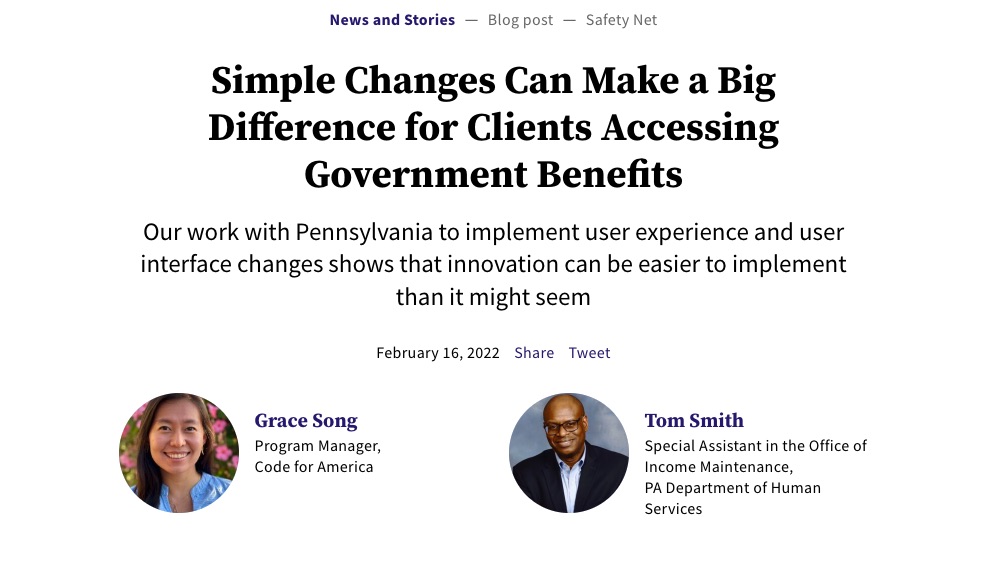
Our work with Pennsylvania to implement user experience and user interface changes shows that innovation can be easier to implement than it might seem.
This annual report details the state’s strategic use of technology to enhance digital services, cybersecurity, equity, and efficiency across government, improving access and outcomes for all Minnesotans.
This session from FormFest 2024 focused on how to help people get the assistance they need from the U.S. Department of Health and Human Services’ work on the Low Income Home Energy Assistance Program (LIHEAP) and the Maryland Social Services Administration’s work to improve welfare support for kinship caregivers.
This session from FormFest 2024 focused on how governments are scaling their SNAP benefits programs, with Maryland’s improved integrated benefits application and the Office of Evaluation Sciences’ changes to questions on the SNAP application.
The California Integrated Travel Project (Cal-ITP) simplifies transit benefits eligibility by developing the Benefits App, which uses Login.gov to securely verify age-based discounts for public transit riders. The project aims to create a standardized, interoperable system for verifying transit benefits, improving accessibility for low-income and special groups while reducing administrative burdens for transit agencies.
Nava built flexible and reusable software and design components to make it easier for Vermonters to access their benefits. These components support Vermont’s long-term vision of integrating eligibility and enrollment processes for all of the state’s healthcare and financial benefit programs.
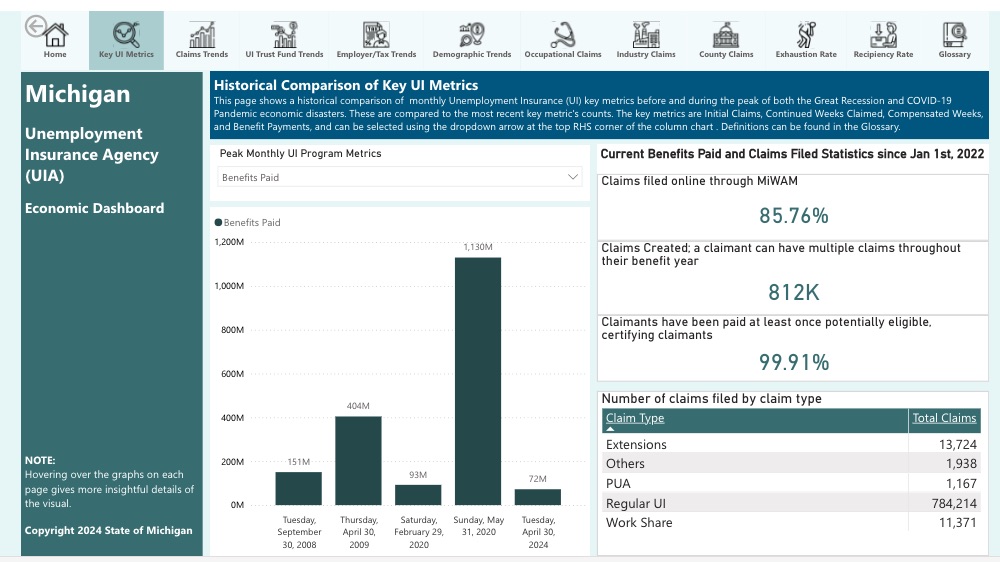
This dashboard provides a comprehensive view of underlying trends in unemployment across Michigan. It serves as an invaluable resource for understanding the impacts of unemployment on various industries, occupations, and communities. By providing detailed insights into sectors experiencing layoffs, claimant demographics, and the regions most affected, the dashboard equips us with the data needed to develop targeted solutions tailored to the needs of Michiganders.