The Michigan Department of Health and Human Services, together with the Food Bank Council of Michigan and the Michigan Department of Education developed a comprehensive Food Insecurity Map and a closed-loop referral system for nutrition and economic supports.
American Public Human Services Association (APHSA)
This brief highlights key takeaways from APHSA’s work on young families, starting with an overview of the young families work and its early years, followed by key takeaways and highlights from its final year, ending with opportunities for future work in the young families space.
American Public Human Services Association (APHSA)
This fact sheet outlines the key principles for designing an effective Child Tax Credit that reduces child poverty, supports working families, promotes racial and economic equity, and delivers long-term benefits for children and the economy.
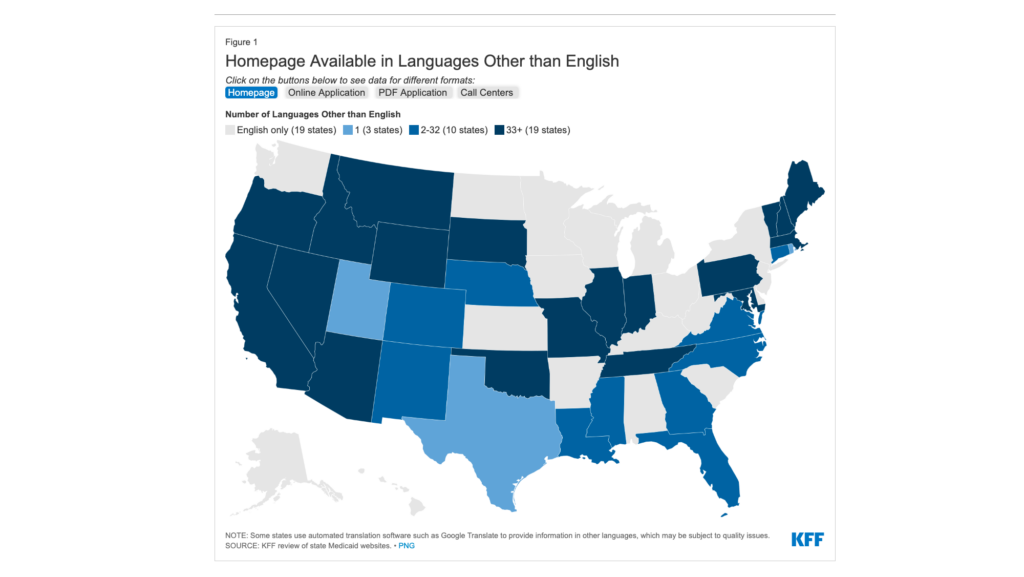
While most states provide basic digital accessibility, this review warns that persistent gaps in language services and disability accommodations create significant barriers for enrollees as pandemic-era Medicaid protections expire.
Dana Chisnell describes work leading a team of researchers to interview people from across the US on their experiences applying for unemployment and other benefits during the pandemic.
The Performance.gov team hosted a webinar featuring federal customer experience (CX) changemakers from across government and focused on the nine CX projects that aim to address pain points learned about through human-centered design research.
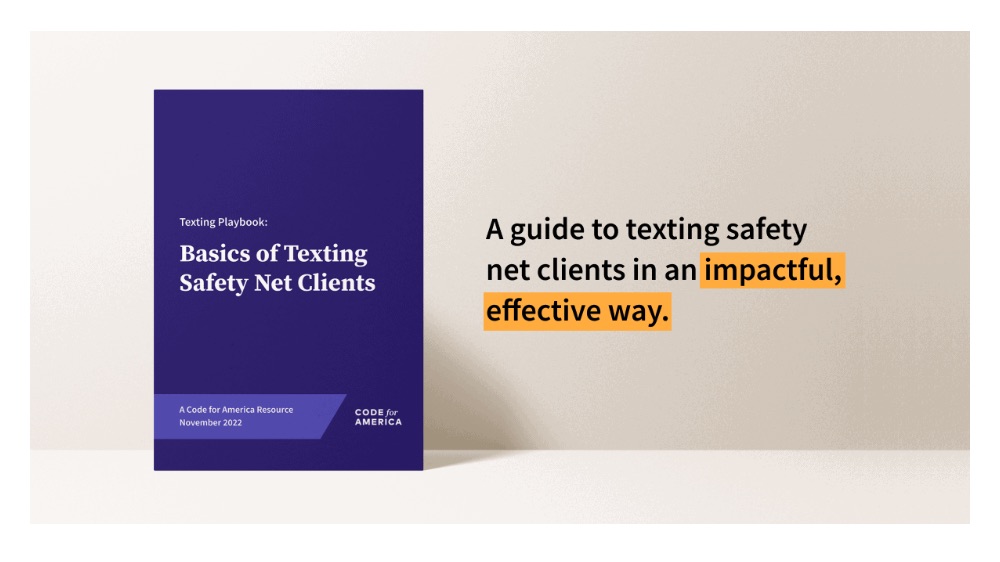
The Texting Playbook provides guidance and well-researched strategies to help state agencies implement texting in support of Medicaid, SNAP, WIC, and other benefits programs. It provides an overview of how to start texting clients; the types of messages to send, including real examples; Federal Communications Commision (FCC) policy guidance; how to encourage opt-ins and collect consent; how to avoid coming across as spam; and a cost analysis of texting.
The Digital Service Network (DSN) spoke with three staff members from the New York State Executive Chamber—Gabe Paley, Tonya Webster, and, Luke Charde to learn more about the state's efforts to improve residents’ experiences accessing government programs.
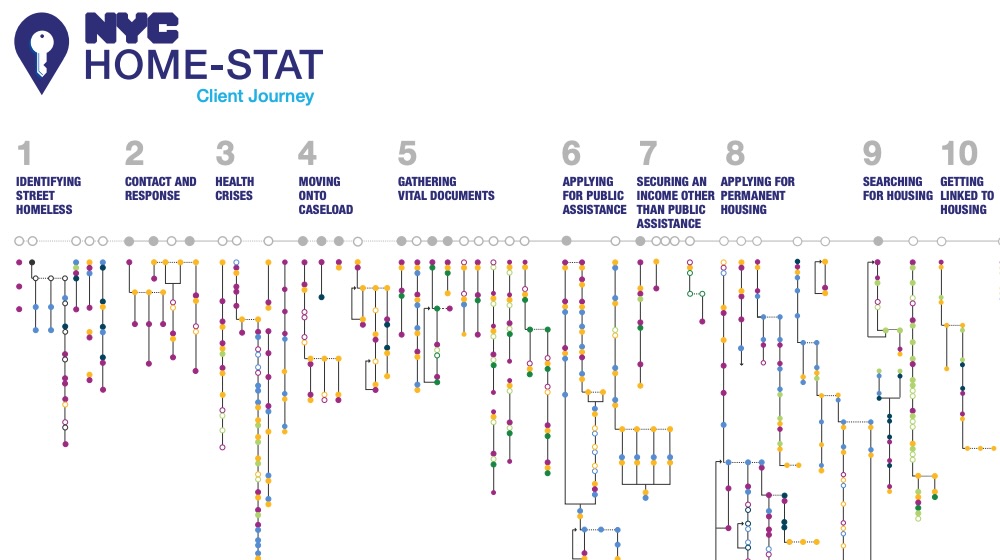
This overview journey map of street homeless outreach reflects the complexity of the service journey from first contact on street to placement in permanent housing.