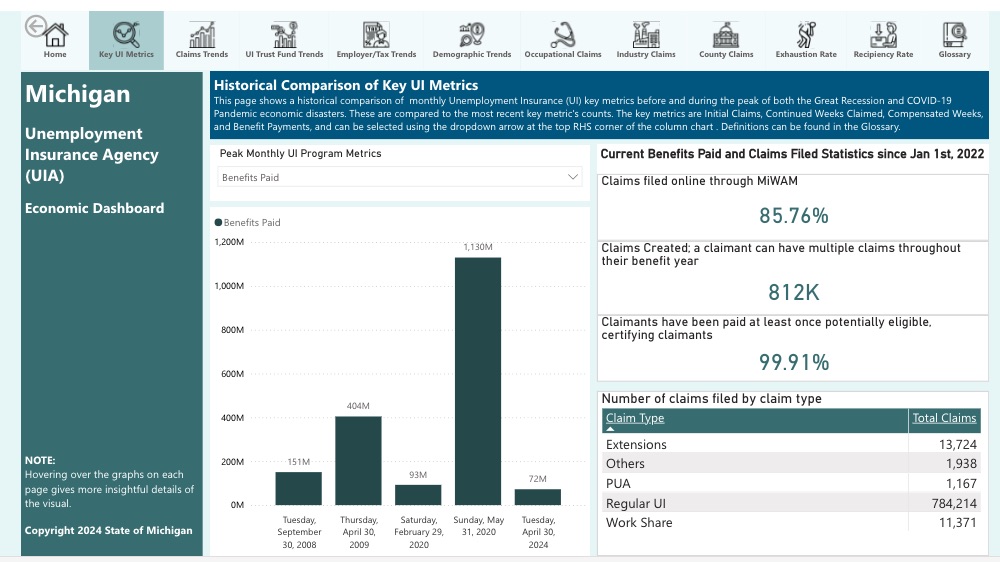
This dashboard provides a comprehensive view of underlying trends in unemployment across Michigan. It serves as an invaluable resource for understanding the impacts of unemployment on various industries, occupations, and communities. By providing detailed insights into sectors experiencing layoffs, claimant demographics, and the regions most affected, the dashboard equips us with the data needed to develop targeted solutions tailored to the needs of Michiganders.
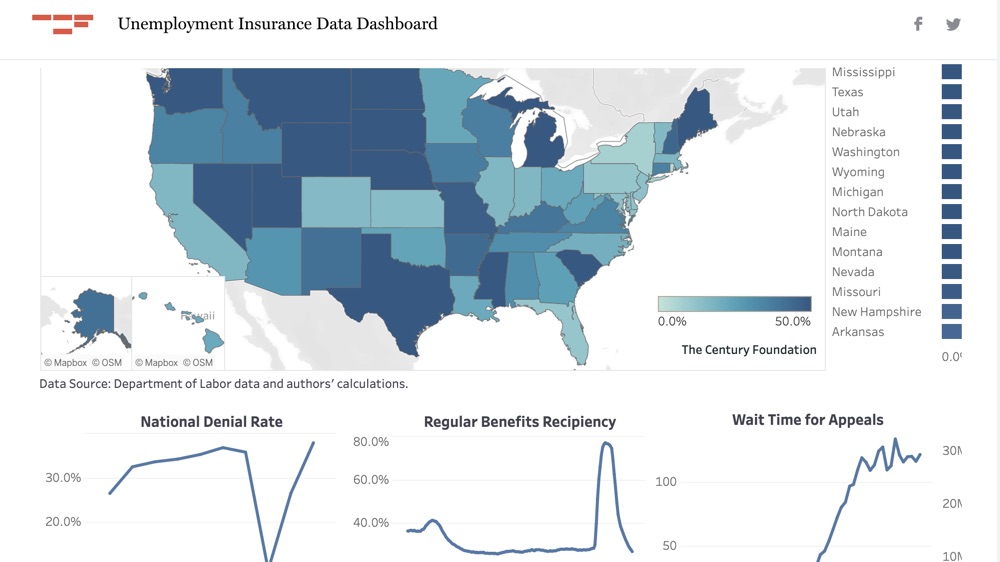
This dashboard highlights key performance indicators for UI systems nationwide, including how they perform during the current economic crisis, the impact of the CARES Act benefits expiring, the timeline for which benefits are delivered, demographics of benefits recipients, and total benefits payments.
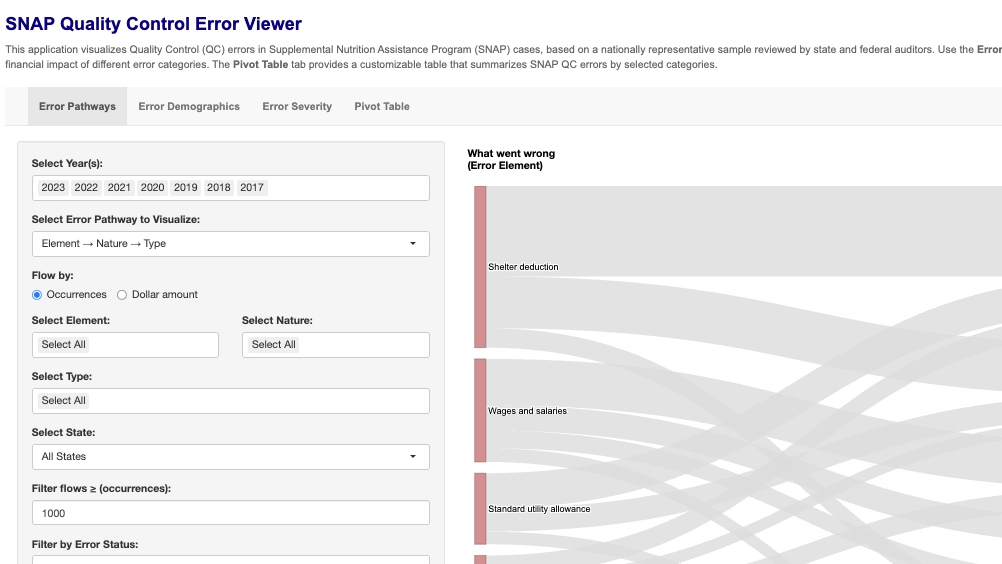
An interactive dashboard that enables users to explore and monitor key metrics of the Supplemental Nutrition Assistance Program (SNAP) Quality Control (QC) system.
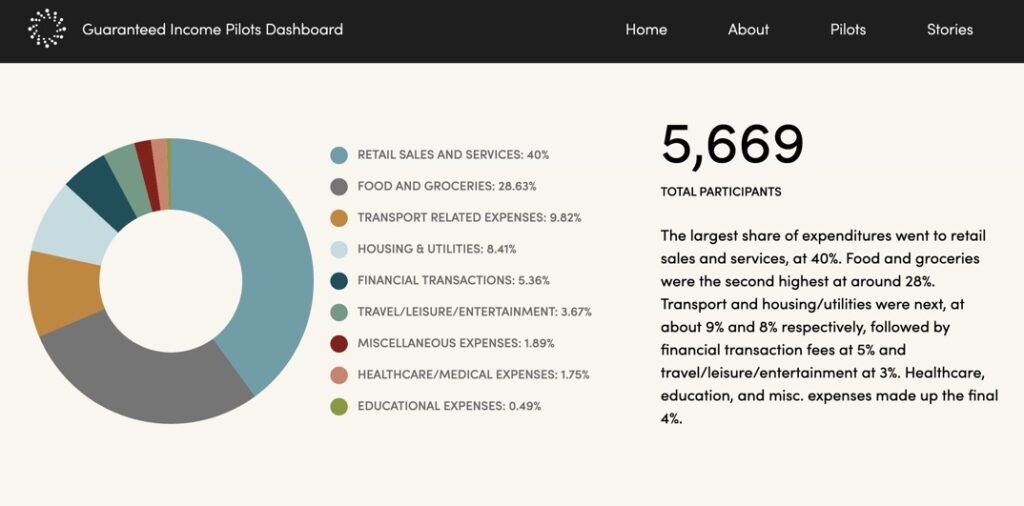
The Guaranteed Income Pilots Dashboard is designed to visualize data from 30+ guaranteed income pilots across the United States. This data and testimonies from participants shed light on ways in which unconditional cash is providing people the opportunity, freedom, and resilience to build financial security.