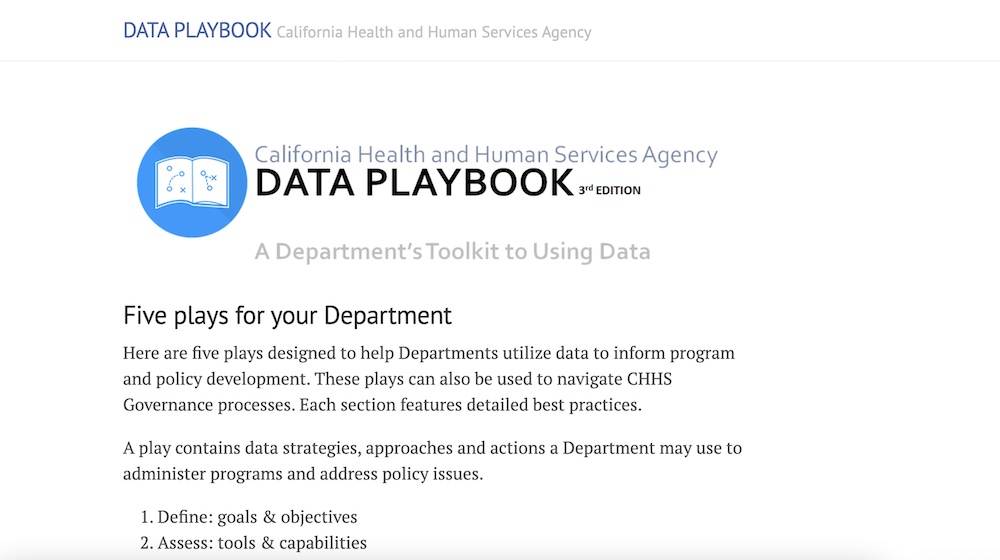
This data playbook created by the California Health and Human services agencies discusses five plays designed to help Departments utilize data to inform program and policy development.
California Health and Human Services Agency (Cal HHS)
Code for America CEO introduces the Safety Net Innovation Lab in a TED Talk, their initiative to work with state governments to reimagine and rebuild delivery of accessible and equitable benefits. This article also includes the video of Renteria’s talk and a transcript.
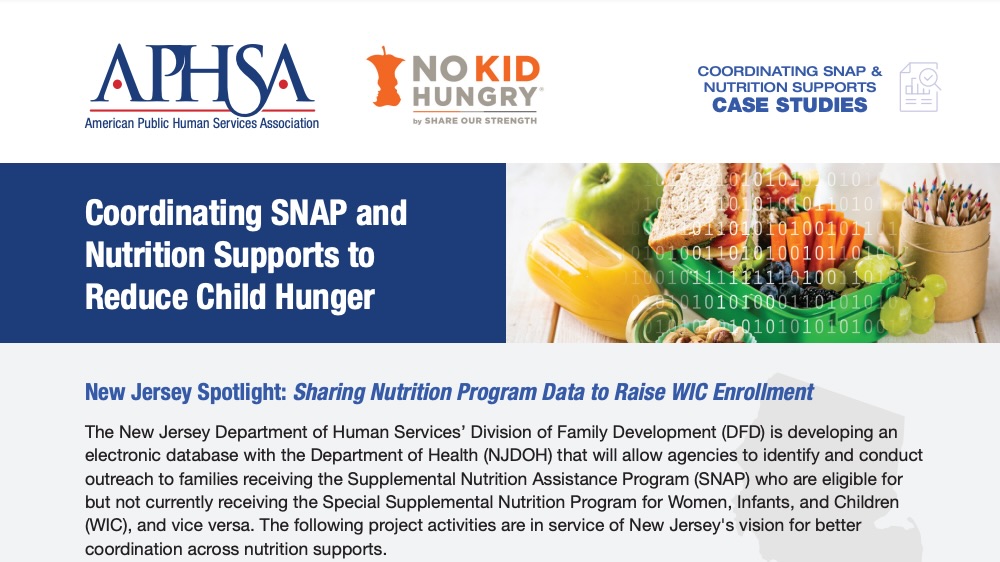
This report outlines how the New Jersey Department of Human Services’ Division of Family Development (DFD) and the Department of Health (NJDOH) are increasing SNAP & WIC co-enrollment through data sharing, outreach, and systems integration.
American Public Human Services Association (APHSA)
This guide highlights best practices in benefits access, showcasing how Michigan, New York City, and San José improve accessibility through plain language, multilingual translation, resident co-creation, and technology tools.
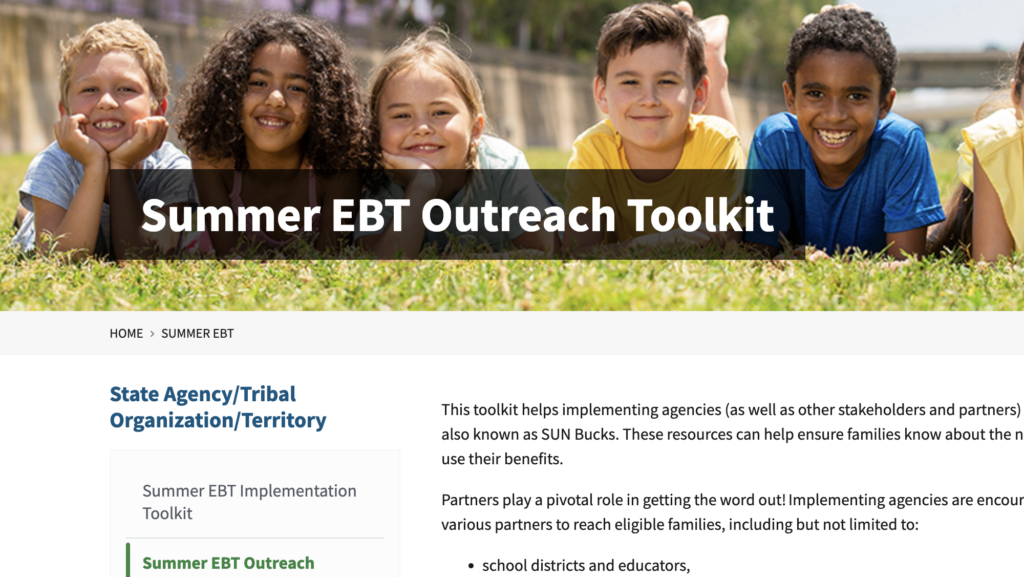
This toolkit provides guidance and resources for state agencies to effectively implement the USDA’s Summer Electronic Benefit Transfer (EBT) program, which helps low-income families buy food during the summer months when school meals are unavailable.
This report contributes to the quantitative measurement of psychological burdens by examining a case study of a single social program: the Supplemental Nutrition Assistance Program, by considering new quantitative measures of the psychological burdens faced by SNAP applicants.
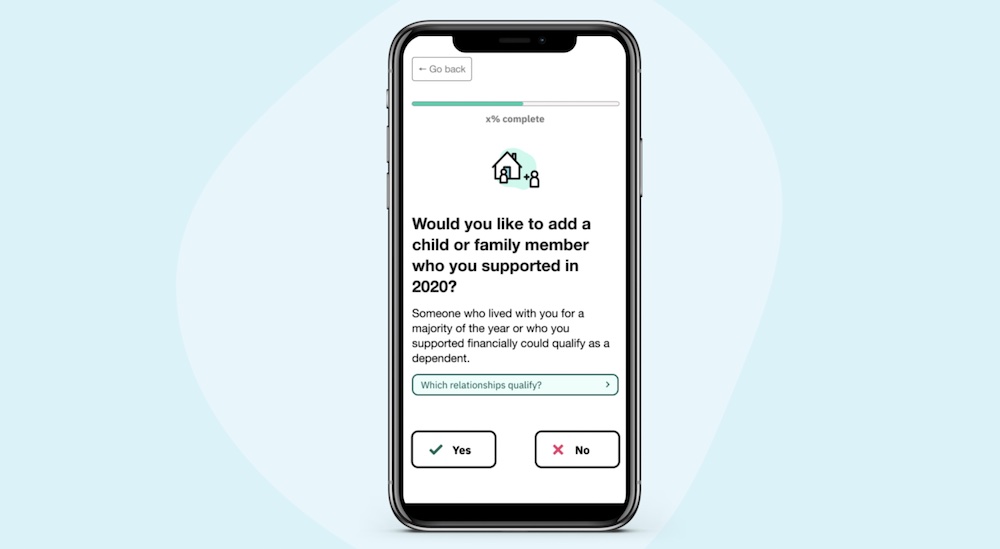
Code for America's GetCTC portal simplifies access to the Child Tax Credit for low-income families by providing a mobile-friendly, bilingual platform for streamlined tax filing.
This article details California's Disaster Relief Assistance for Immigrants (DRAI) program, which provided $500 in cash aid to undocumented adults affected by the COVID-19 pandemic, highlighting the collaborative efforts between the state, community-based organizations (CBOs), and Code for America to distribute $75 million to 150,000 individuals.
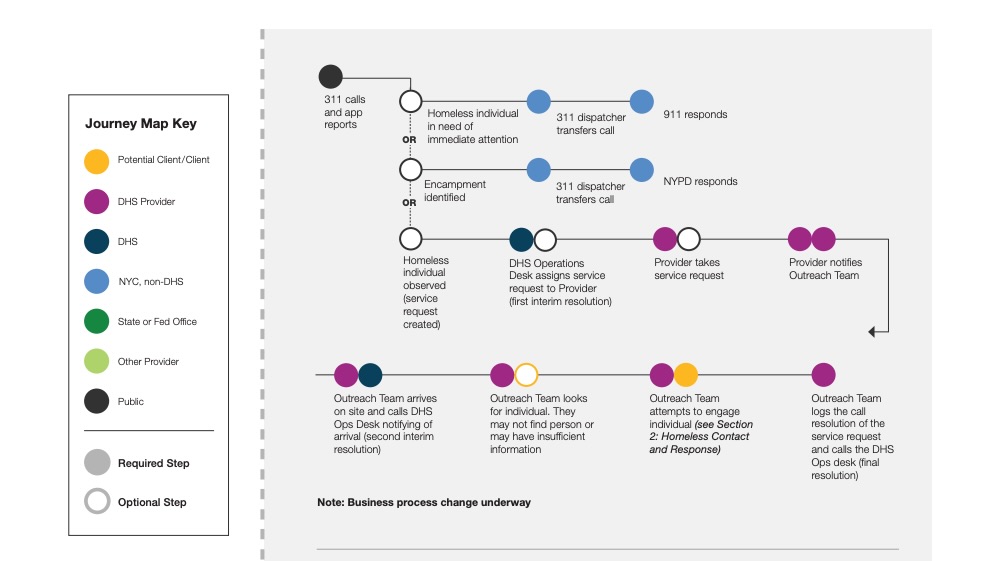
This overview journey map of street homeless outreach reflects the business process, and worker and client experience during the period January–April 2016 from initial observation, contact, case management, and placement in permanent housing. The map is displayed in eleven high-level sections, each with individual sub-level sections. Summaries and details for all the sections are presented in the subsequent pages. Each dot represents an individual or agency. Each cluster of dots represents a service interaction.